Leading a small company to become big is all about focusing on your go-to-market. This article helps you identify and verify the market that you choose.
We go through the five necessary steps to follow to focus on a single niched market and then launch your Go To Market motion.
1 - Identify Your Total Addressable Market
Your Total Addressable Market, also known as TAM, is determined by the market that you want to play in. Your TAM includes every type of customer that you would like to reach if you had unlimited resources and time. The dollar value of the size of your market is the total market demand for the product/services category and the potential scale of the category.
If the market you have picked is established, it often has solid analyst coverage, and potentially a Gartner Magic Quadrant, Forester Wave or equivalent “name” for the category.
Examples of established categories that could be your TAM definition:
Most small companies will focus on a subset of the established markets described above. Other companies will try to make a new market.
Smaller, or less mature markets, can be found on marketplace websites, or recommendation- and review websites. Examples are G2 and Capterra, among others. If a category is ripe to have a TAM analysis, chances are you can find it on an online review or analyst site.
Learn how to segment your market to reach product market fit.
2 - Prioritize your TAM
If you know what our Total Addressable Market is, the first step towards your SaaS Go To Market focus is to select a segmentation model to divide the market into meaningful chunks.
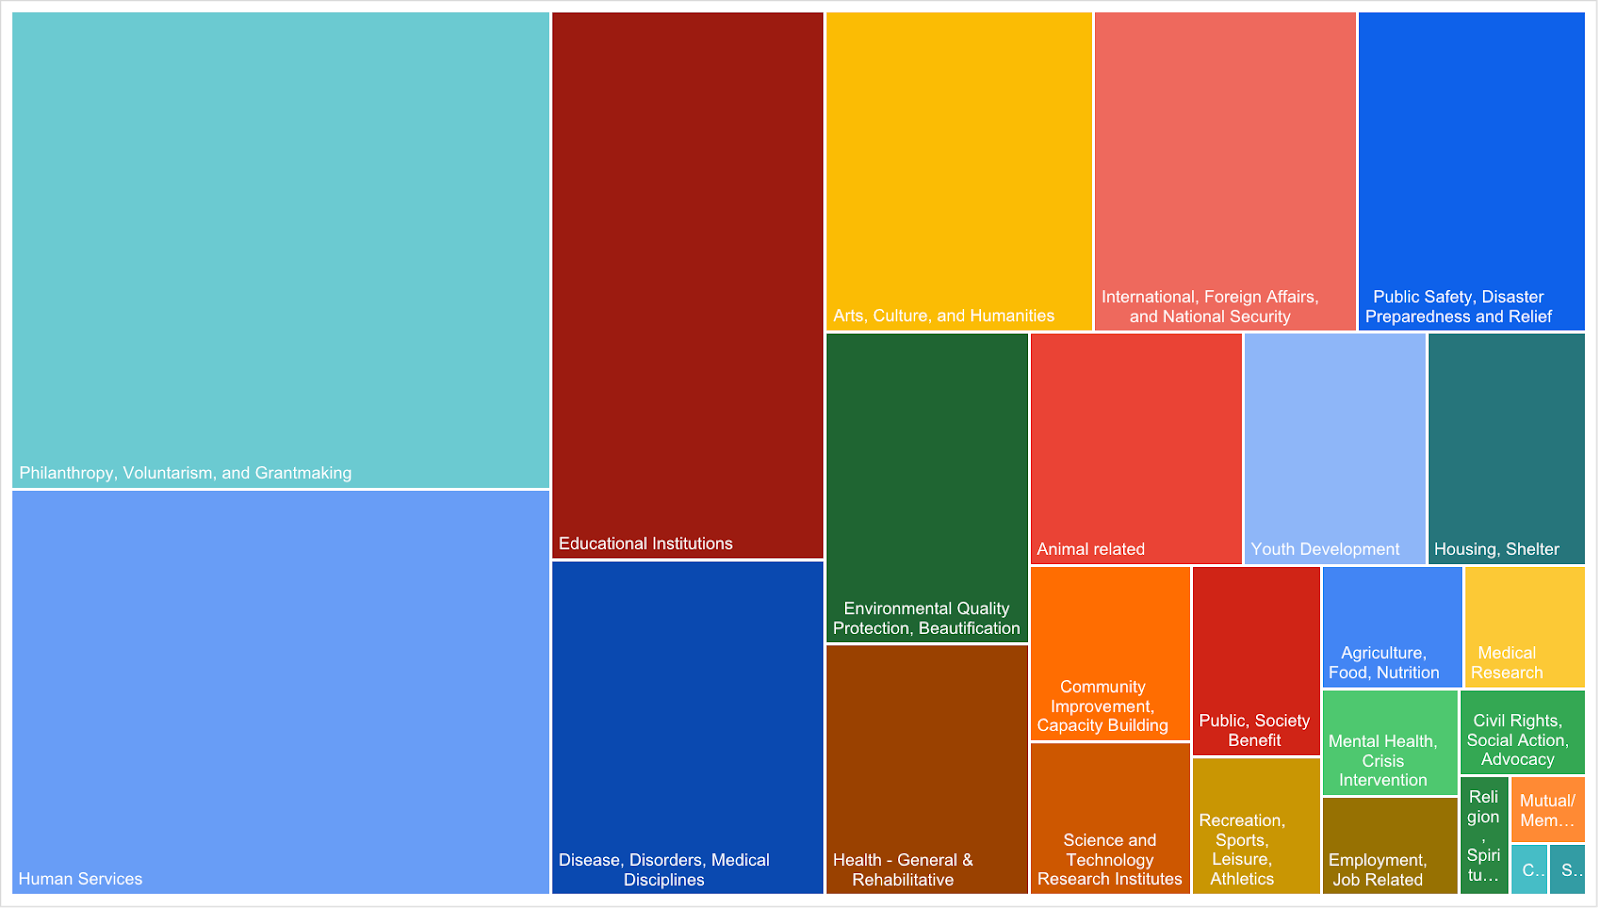
Each business will have their own segmentation that makes sense. If you are a software company providing Subscription Payment Solutions, a simple way to segment the market could be by Industry Vertical. For a provider of services to Non-profits, the below distribution in Donations reported for Non-Profits sub-segments making up a $63B market, could be a good start.
As an example, I’ll share the analysis that our team at
Kalungi has used to focus our Go-To-Market in the past. Our business is focused on helping software companies that have recently been funded, to deploy their growth capital fast and in a responsible, efficient way that maximizes quick returns.
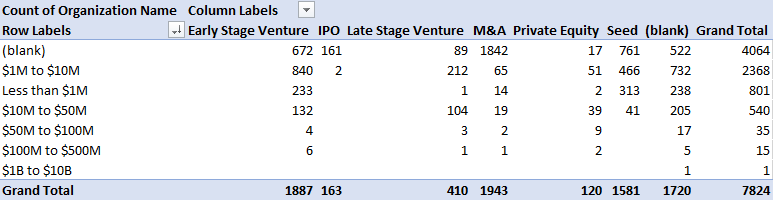
Our TAM can be described as all the software companies in North America that have been funded recently. Below table shows these 7824 Companies and Organizations, grouped by Revenue Band.
If you use Excel, a simple dataset like this can quickly be turned into some cool heat maps as well: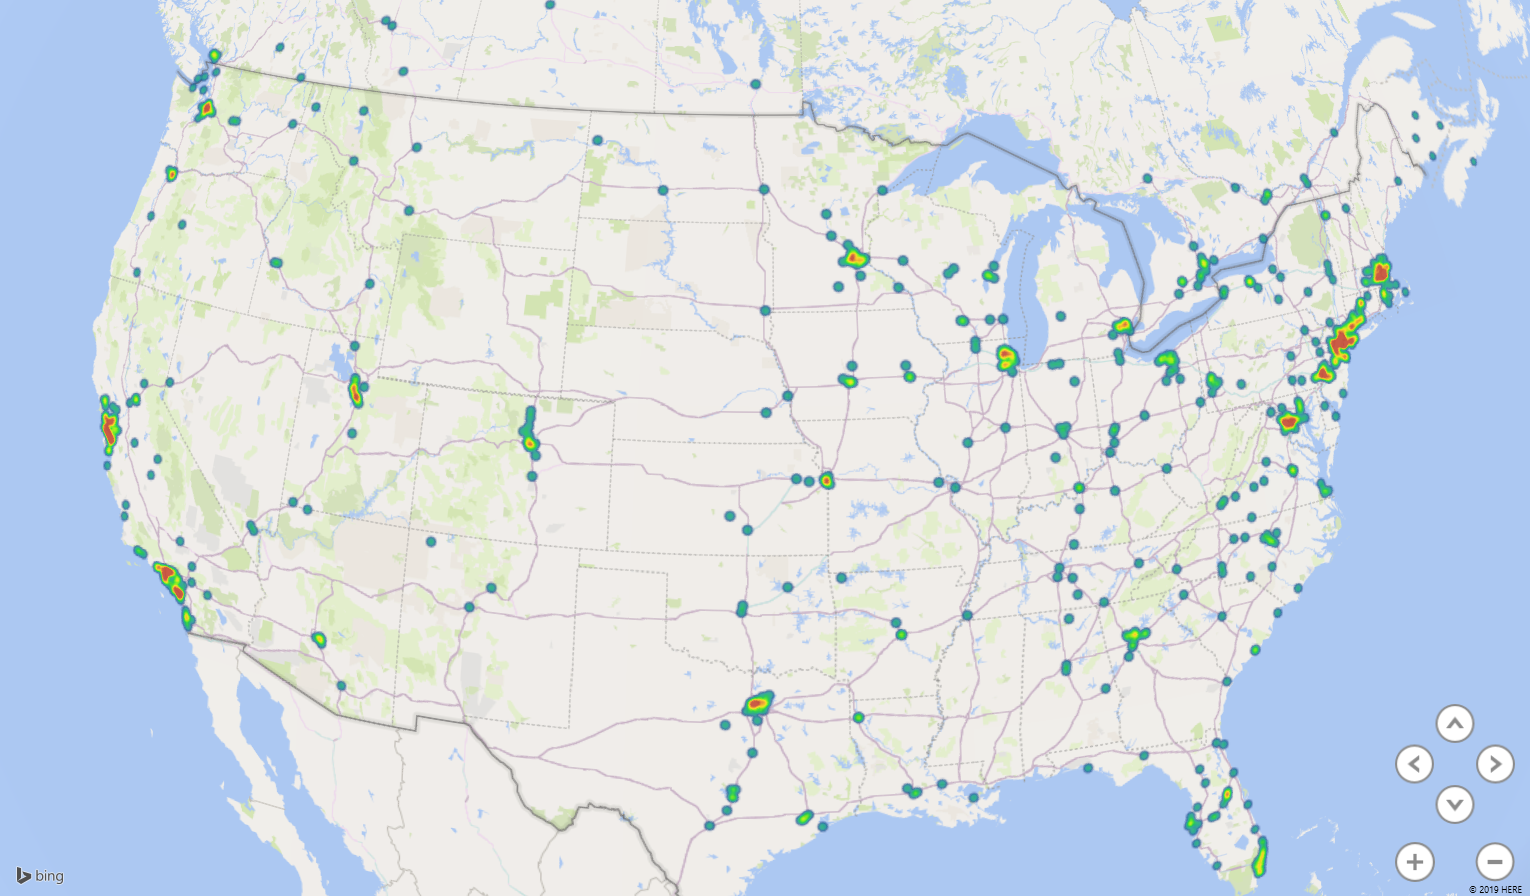 A mistake many business leaders make is to use the above type of analysis to focus on the big segments (or “hot spots”). This can be disastrous. Read on to understand why.
3 - What’s Your Serviceable Addressable Market?
Your Serviceable Available Market, or SAM, is limited by how your Technology and Services can provide the best service for the market. Ask yourself:
To find your market to focus on, you need to know what you do best.
- Which customers give you the best Customer Satisfaction scores? (or NPS Scores)
- In what part of the market do you have a Negative Customer Churn?
- Which customers provide references and referrals?
Finding the best bridge for you to go from TAM to SAM is about finding the best way to define who fits your value proposition. To define your SAM, you have to apply the right segmentation to your TAM.
This is how Kalungi segmented our market:
- Firmographic Segmentation:
- Size: Revenue >$1M ARR
- Geography: North America
- Funding Status: Received a Growth Capital Injection in the last 2 years (eg VC)
- M&A: Recent change of control
- Industry: Computer Software, Internet, IT, Computer & Network Security
- Custom Data Segmentation
- Business model: SaaS, servicing B2B
- ACV: $/Customer >$12k/Year
- Recent Executive Change
- Department Headcount: <4 people dedicated to Marketing
- Company Headcount: 20 to 200
We then used the data points under #2. Then we enriched a list to analyze the companies that fall into those categories and then apply firmographic filters available in public databases, such as Crunchbase.
Filter 1: Revenue Size - This filter takes the TAM from 7825 to 7023 entities.
Filter 2: Financial Data - Taking out IPO takes us to 6860 entities. Funded ‘recently’ reduces the SAM to 2240 (90 companies out of these were acquired. We will exclude these.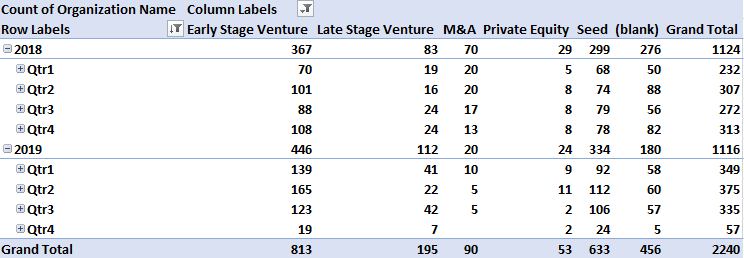
If you have not reached Product Market Fit, or are in an immature category, the above methodology using Firmo-graphics and Demo-graphics will be hard. You probably have to revert to Psycho-graphics and “Job-to-be-Done” segmentation models to get your best SAM.

Another analogy is a Beachhead to describe the SAM part of this analysis. Where do you currently win and have momentum? Just like a Beachhead on D-Day provided the Allied forces advantages like access to supply lines, and an ability to bring in reinforcements and heavy armor. Your Product Market Fit Beachhead gives your access to segment-specific endorsements, and referrals. It provides you with a potential opportunity to dominate a part of the market and prevent having to compete on price.
4 - Let’s Choose Your Serviceable Obtainable Market
The Serviceable Obtainable Market, SOM, is the percentage of your market that you can realistically capture.
Consider the following questions:
- How many customers can you reach and serve, especially given a specific time frame?
- How hard will it be to compete in specific parts of the market?
- Are certain trends or policy changes going to help or hurt you?
- Where is your sales team located?
- What channels do you have available?
- What channels can you build and how fast?
Determining your SOM is all about picking a Niche based on what only you can do, where to go first, and then nailing that Niche. You need to think about the following factors:
- Ease of Growth.
- The difficulty of the sales process (decision complexity).
- Techno-graphic Fit of your Solution with Technology your Prospects use.
- Ability to win/dominate a part of the market (Competitors?).
- Entry Barriers like Regulatory Fit (can make it hard to win, or hard for others to enter).
- Will you have to build/buy/partners to Go-To-Market (your team, skills, capacity).
To build on the Normandy Landing analogy, this is about finding the easy path to victory. Some beaches were easier to land, such as Omaha Beach.
To test your SAM and turn it into your SOM, you can start with listing your "dream clients" and your current customers, and divide them as follows:
- Customers you don't want more of.
- Customers that you would not decline, but also don't seek out.
- Customers that you want to find more of.
Verify the last category by creating a database of your existing customers, including the segment data you have used for your TAM calculation. Look for meaningful outcomes that indicate success in your business (recurring revenue per customer, number of users, etc.). Use this to come up with what you think of as your Ideal Customer Profile, or ICP.
To finish the example, here's how Kalungi determined its SOM from the SAM.
- Where can we win and dominate? Close to home, so we set the Geography to only include PST and MT time zones.
- We tightened the "Funding Status" to only companies who received a Growth Capital Injection in the last year.
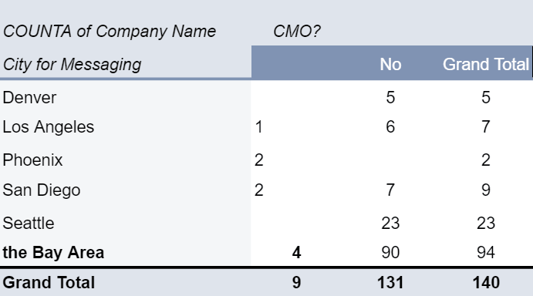
- Finally, we took out companies who have a confirmed Marketing Leader, or a Marketing Team with four or more people.
This is where we landed with the SOM for 2020 for Kalungi:
5 - Honing In On Your Go-To-Market Focus
To summarize how we go from TAM to SAM to SOM, or better, how we prioritize the Go-To-Market (GTM), we used the following two dimensions.
Penetration (Fit and our Beach Heads)
Where do we have Beachheads that we can exploit and show credibility to new prospects?
- Existing testimonials in specific verticals/use cases
- # of logos in specific vertical/sub-vertical/use case
- Customers referring to others. Where do we have Reference Customers?
- The churn of existing clients (loyal client types indicate fit)
- ARPU growth (Customers expand their spend with us, indicating fit)
- Example formula: ARR of existing clients divided by the total ARR for a specific ARR TAM
Ease-of-Growth (Lowest Friction)
To find what customers are going to be easy to drive growth, we look at the following signals:
- How easy is it to sell (decision-maker complexity, size of the organization)
- Competitive presence. Where are our competitors, and can we find a space where they are not?
- Technical compatibility (supported integrations with existing solutions they use)
- Regulatory/compliance advantages
With those two axes, we can rank the different verticals in order, and it’s all about relative position. In a bubble chart, we can create bubbles the size of the ARR TAM for each vertical.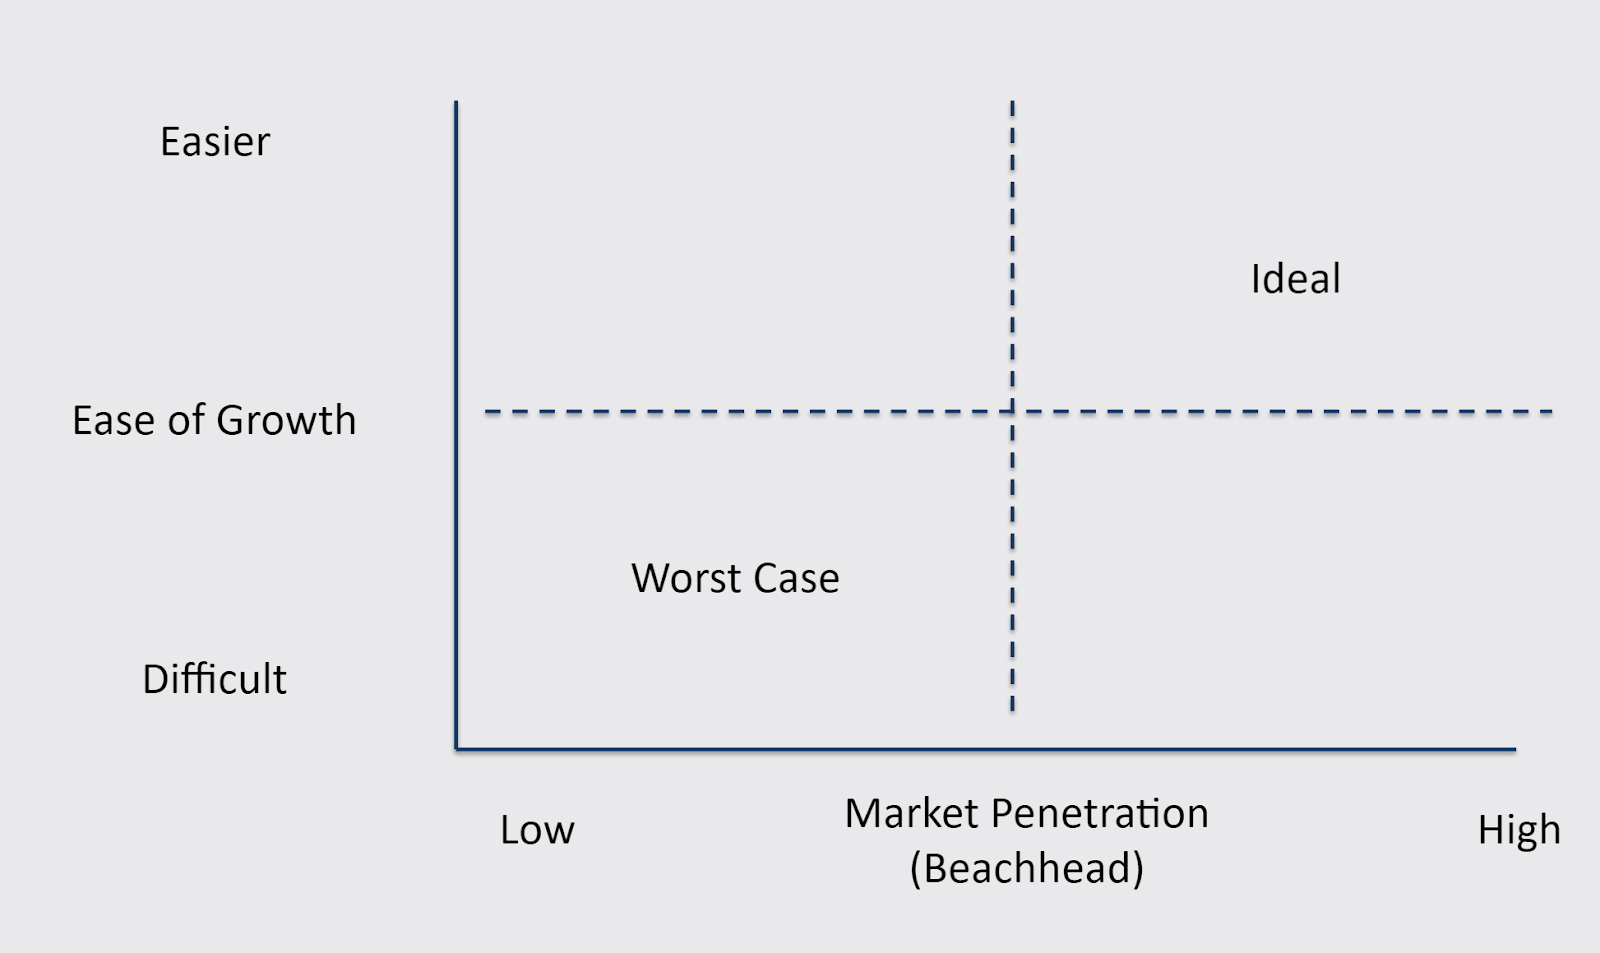
Focus on Your Go To Market and Your SaaS Will Grow
Once you’ve analyzed your potential market and honed in on your SOM, you’re ready to apply your GTM strategy so that your SaaS can take off.
If you need support with your GTM, Kalungi provides B2B SaaS companies with a fractional CMO and complete team of experts so you can scale fast. Reach out today to discuss your marketing strategy.