Strategy & Planning
How to Structure Your B2B SaaS Sales & Marketing Funnel the Right Way
Struggling to align your B2B SaaS sales and marketing funnel? Learn how to structure each funnel stage to drive predictable revenue growth.

Mike Northfield
A common question that pops up for B2B SaaS sales and marketing VPs is what are "good conversion rates" for the various stages of the funnel.
This is a very tricky topic since every customer segment and go-to-market approach will drive wildly different answers to this question. It's not an impossible question to answer, however, because there is some data available to us.
The benchmark sales and marketing conversion rates below won't beapplicable to every team, company, or situation. It's an average of data points we've collected from 7 B2B SaaS startups over the past 5 years. We added some data from other CMOs who work with B2B SaaS companies. as well
It's a starting point. Nothing more.
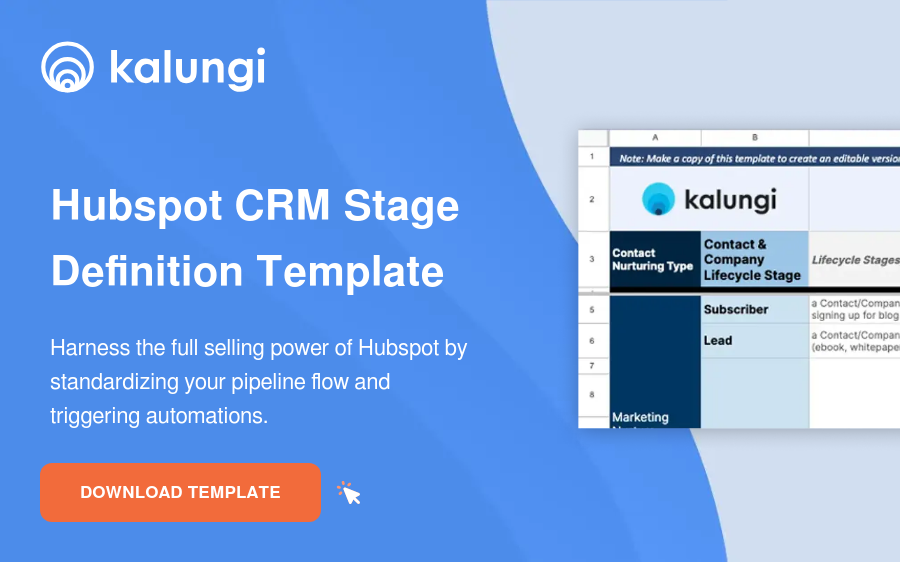
If you're still looking to better define your funnel stages, download our template below to give yourself a headstart.
.webp?width=218&height=178&name=Kalungi%20-%20Lifecycle%20Stage%20Criteria%20Template%20(1).webp)
Inbound conversion rates will measure the success of your SaaS company's inbound marketing programs, online presence, and lead nurturing through content like an eBook, video, or whitepaper.
| KPI Stages | Next goals | Average |
| Unique visitors | Get contact details | N/A |
| Contacts & Subscribers | Nurture to MQL | 5.00% |
| Marketing Qualified Leads (MQL) | Get a meeting | 20.00% |
| Sales Accepted Leads (SAL) | Qualified by SDR | 43.75% |
| Sales Qualified Leads (SQL) | Qualified by Account Executive | 63.33% |
| Opportunities (CRM) | Assign opportunity amount ($) and product | 43.33% |
| Wins | Revenue committed by the prospect | 31.25% |
| All-up conversion rate (top to bottom) | Visitor to win | 0.05% |
Your outbound conversion rates will rely heavily on the quality and fit of your initial prospect pool, the channels you use to reach them, and the quality of messaging and content you use in those channels.
| KPI Stages | Next goals | Average |
| Outbound contacts (Prospects) | Prioritize targeted outreach and content | N/A |
| Marketing Qualified Lead (MQL) | Get a meeting (BDR) | 15.00% |
| Sales Accepted Leads (SAL) | Qualify by SDR | 42.50% |
| Sales Qualified Leads (SQL) | Qualify by Account Executive | 55.00% |
| Opportunities | Assign opportunity amount ($) and product | 50.00% |
| Wins | Revenue committed by the prospect | 37.50% |
| All-up conversion rate (top to bottom) | Visitor to win | 0.03% |
To make this meaningful, you should benchmark your funnel and use that data to inform improvement initiatives. We often see companies that don't define stages, statuses, or entry/exit criteria for their funnels.
If your sales and marketing teams aren't aligned on the definitions at each stage of the funnel, your conversion measurements won't be accurate. Below is the template we use with our clients to get S&M funnel alignment. This will also set the stage for your sales and marketing automation requirements for your sales and marketing tech stack.
Here are a few other sources reporting on B2B SaaS marketing funnel conversion rate benchmarks:
11 Marketing KPI Reports with Industry-Specific Benchmarks

Struggling to align your B2B SaaS sales and marketing funnel? Learn how to structure each funnel stage to drive predictable revenue growth.
Learn how to build and refine your B2B SaaS marketing and sales funnel. Discover 7 essential stages and actionable tips to drive growth and retention.

Learn when to invest in paid media based on SaaS growth stage, GTM readiness, and funnel performance.