Channel Marketing
The Power of Multi-Channel Marketing for B2B SaaS Companies
Get your B2B SaaS company in front of the right customers with multi-channel marketing. Drive growth and establish your brand as an industry leader.


Antoine Vial
The SaaS industry is highly competitive, making it essential to understand how your marketing efforts stack up. What should you compare your performance to? And how do you know if you’re on track or need to make serious adjustments? B2B SaaS benchmarks offer valuable insights, helping you compare against industry averages and gain clarity.
Keeping up with industry trends isn’t easy, especially with rapid technology changes. Knowing what defines a healthy growth rate is critical for SaaS business owners aiming to thrive. Access to accurate B2B SaaS metric benchmark reports is one of the most efficient ways to measure performance.
To help, we’ve collected data from over 100 ventures and built a comprehensive B2B SaaS benchmarks data set. This blog highlights seven key SaaS metrics to evaluate and optimize your marketing.
Want to see how your SaaS company stacks up against industry benchmarks? Download our 2023 B2B SaaS Benchmarking Report now to start optimizing for success. We've gathered data from over 100+ ventures to create a comprehensive B2B SaaS benchmarks data set—all accessible in this report.
Here are seven essential metrics every B2B SaaS company should monitor. Each plays a critical role in assessing and optimizing your marketing and overall performance.
In the next sections, we’ll dive deeper into each metric, explaining why it matters, how to measure it, and what benchmarks you should aim for.
“How much should I spend on marketing? And on what?”— two common questions for CEOs of B2B SaaS companies. Identifying areas that bring considerable recurring revenue and knowing how to balance long-term vs. short-term goals is central to your GTM strategy.
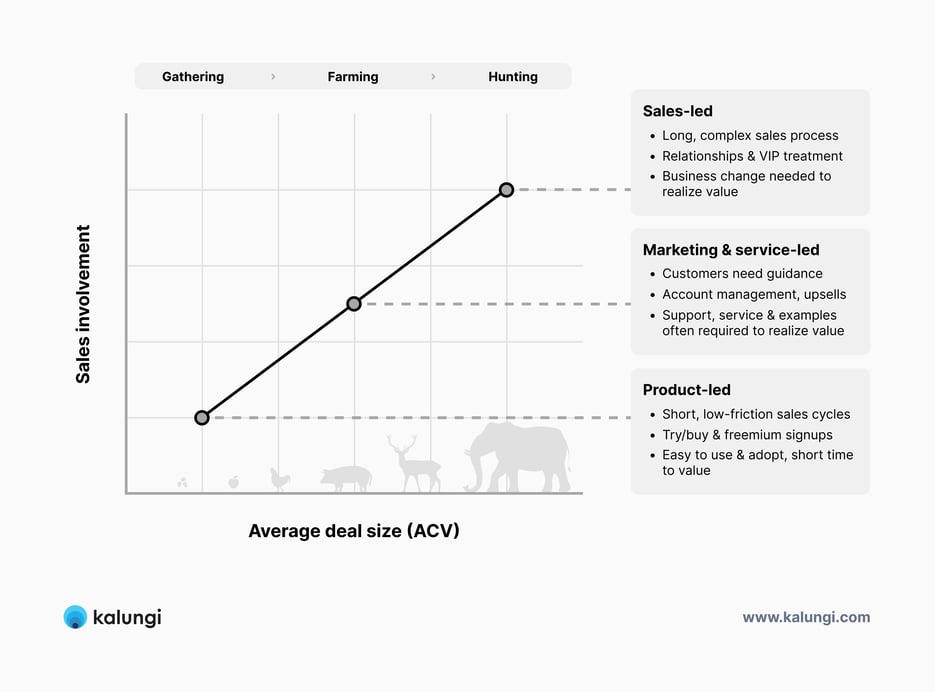
Regardless if you took a sales-led or a product-led approach, the ideal marketing budget can be broken down into three main categories:
Branding: This includes activities that build awareness and recognition for your brand, such as paid advertising, public relations, product releases, and social media marketing.
Lead generation: This includes activities that generate interest in your products or services, such as content marketing, email marketing, and paid search advertising, paid social, webinars.
Sales: This includes activities that close sales, such as in-person events, sales/discovery calls, demos, and white-glove customer support.
There is no one-size-fits-all answer, as the ideal budget will vary depending on your industry, company size, and target audience. A good rule of thumb is to allocate between 10 and 40% of your total revenue to your marketing spend. This range is based on industry research and experience working with B2B SaaS startups following the T2D3 growth. Here's a high-level breakdown:
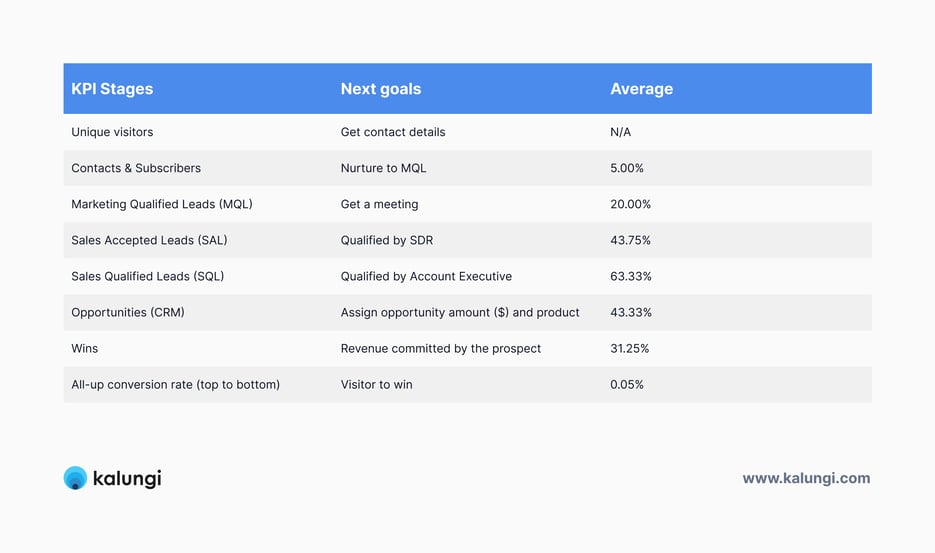
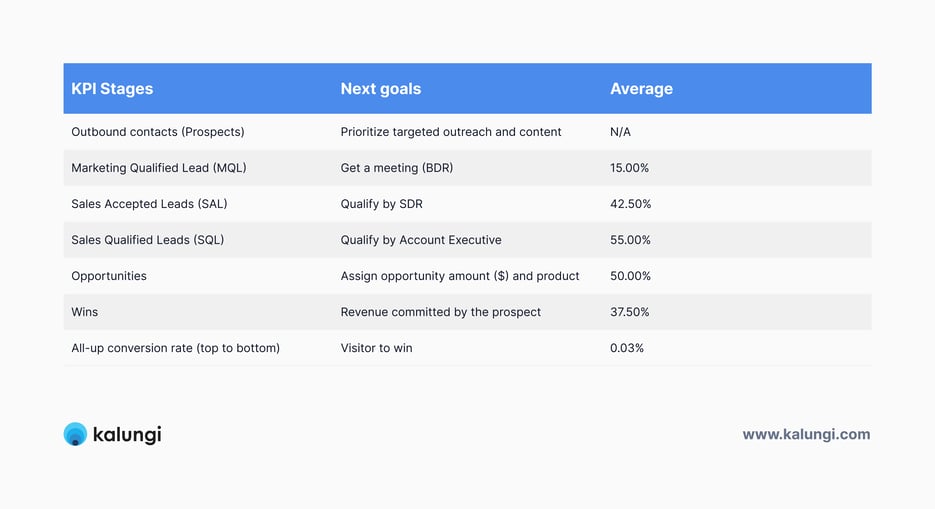
Marketing funnel conversion rates measure how effective your marketing efforts are at converting leads into customers. For B2B SaaS companies, the full marketing and sales funnel typically consists of three stages.
Awareness: this is the stage where potential customers learn about your product or service: website visitors, subscribers & leads.
Interest: this is the stage where potential customers begin to research your product or service and compare it to other options. Marketing Qualified Leads (MQLs) and Sales Qualified Leads (SQLs).
Decision: this is the stage where potential customers decide whether or not to purchase your product or service. Opportunities (deals created), close won/lost.
.webp?width=935&height=1403&name=Lifecycle%20Stage%20(Funnel).webp)
According to our research and experience with nearly 100 SaaS companies, an average full-funnel conversion rate (visitor to customer) is 0.05% for inbound marketing and 0.03% for outbound marketing. (add tables)
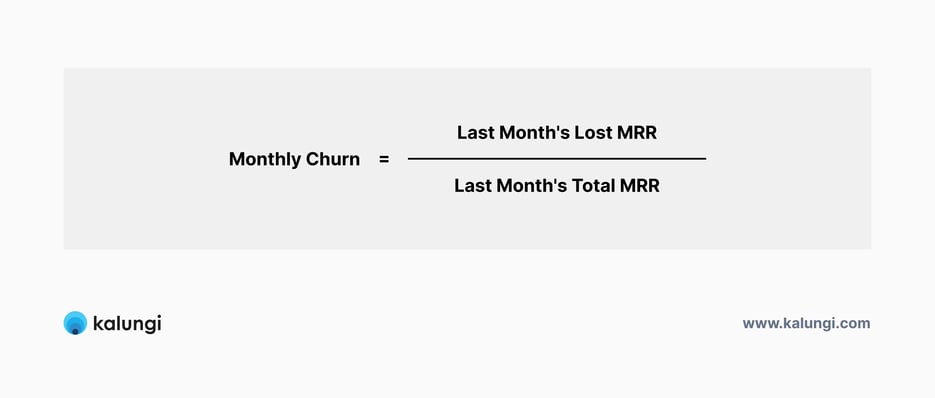
Customer churn rate is the percentage of customers who stop using a product or service within a specified period. A monthly churn rate is most commonly used.
A high churn rate for B2B SaaS companies can lead to high revenue loss. It will also lead to a loss of trust since customers that have invested time and money in learning how to use your product or service will not recommend your product & services. Worse, leave bad reviews on software review redirects like Capterra/G2/Software Advice. A low churn rate, on the other hand, can lead to exponential growth.
Several factors can contribute to customer retention:
Product quality: if your product is not meeting the needs of your new or existing customers well, they are more likely to churn.
Customer support: new customers are more likely to churn if your customer support is not responsive or helpful.
Pricing: Customers are more likely to churn if your pricing is too high.
Competition: If there are other, better products on the market, customers are more likely to churn.
A healthy churn rate for a product-led growth company that has reached PMF is 5% to 10%, while it should be below 5% for sale-led growth. Companies that are in year three (above $10M ARR) of or beyond the T2D3 growth curve should aim for closer to a 1% churn rate.
There are several things you can do to reduce churn rate, including:
Continuously improve your product: Make sure your product meets your customers' needs and is constantly being improved by asking your customers what they need.
Provide excellent customer support: Ensure your customer support is responsive and helpful.
Offer competitive pricing: Make sure your pricing is competitive with other products.
Differentiate your product from the competition: Make sure it offers something unique that sets it apart from other products.
Regardless of your pricing model—value-based, flat rate, freemium, per user, per feature—Annual Recurring Revenue (ARR) and Monthly Recurring Revenue (MRR) is the holy grail metric of the SaaS model. B2B SaaS companies are valued based on their capacity is growing annual recurring revenue, YoY. While it’s hard to benchmark for ventures in the MVP stage, most companies under $2M in ARR have not yet reached PMF.
Post PMF, according to the Kalungi playbook for T2D3 revenue growth, here is the ARR benchmarks for the first five years:
Year 1 – Triple from $2M to $6M ARR
Year 2 – Triple from $6M to $18M ARR
Year 3 – Double from $18M to $36M ARR
Year 4 – Double from $36M to $72M ARR
Year 5 – Double from $72M to $144M ARR
%20or%20Monthly%20Recurring%20Revenue%20(MRR).webp?width=684&height=328&name=Annual%20Recurring%20Revenue%20(ARR)%20or%20Monthly%20Recurring%20Revenue%20(MRR).webp)
As you can see in the previous illustration, the curve is quite steep and presents a significant challenge for B2B SaaS companies. However, this is not a new finding. A McKinsey study in 2014 called "Grow Fast or Die Slow" explored this topic in depth. Although the data is a bit dated, the study provides solid performance metrics and a trusted SaaS benchmark analysis to validate your annual ARR growth rate.
If you want to reach that impressive $1 billion unicorn valuation, it's time to shift your priorities from T2D3 exponential revenue growth to profitable growth. Investors commonly refer to the Rule of 40, which means that when you combine your compound annual growth rate with your profitability, the total should equal 40 percent. As your revenue growth slows down, perhaps to 30 percent, you'll need to make up for it by generating at least 10 percent profit, which will add up to 40 percent. To achieve this, shifting your focus from reducing Customer Acquisition Cost (CAC) to optimizing Cost-to-Service (CTS) is important.
Net promoter score (NPS) is a customer loyalty metric that measures how likely customers are to recommend your company's products or services to others. NPS is calculated by asking customers: "How likely are you to recommend our company to a friend or colleague?" Customers are then asked to rate their likelihood on a scale of 0 to 10. NPS is calculated by subtracting the percentage of detractors from the percentage of promoters. The final score should be anywhere from -100 (all are detractors) to +100 (all are promoters).
.webp?width=935&height=377&name=Net%20Promoter%20Score%20(NPS).webp)
Customers rated 9 or 10 are considered promoters; they are your brand fans. Use this customer base for social proof on software review sites like Software Advice, Capterra, and G2. They'll amplify your sales and marketing efforts by telling their customer success stories.
Customers who rate a company 7 or 8 are considered passives, and customers who rate a company 0 to 6 are considered detractors. Knowing which customers are at risk may allow you to reduce your revenue churn rate. Run customer interviews, and get a more in-depth insight into how to improve your customer relationships.
The creators of NPS, Bain & Company, note that a good NPS score is 0 and above. Above 50 is excellent, and above 80 is world-class.
In the SaaS industry, where the average score is +36, a score greater than 36 would be considered good. Still, our customers typically achieve 50% (google falls in this category) higher than this, and it should be your ultimate goal to match leading players in the industry.
Cost to service (CTS) is a metric that measures the cost of providing a product or service to a customer. CTS is important for B2B SaaS businesses because it can help them understand their profitability and allocate resources effectively.
CTS is calculated by dividing the total cost of a product or service by the number of customers. The total cost of providing a product or service includes the cost of marketing, sales, onboarding, and customer support, among other expenses. SaaS businesses with high CTS will experience a slow expansion revenue growth rate.
High CTA can only be justified early in the MVP growth phase. Here's why:
A high CTS indicates that a business is spending a lot of money to provide its products or services to customers. This can lead to lower profitability and make it difficult for businesses to compete. This is often true for early-stage ventures trying to reach PMF.
A low CTS indicates that a business is spending less money to provide its products or services to customers. This can lead to higher business performance and makes it easier for B2B SaaS ventures to enter the T2D3 growth stage.
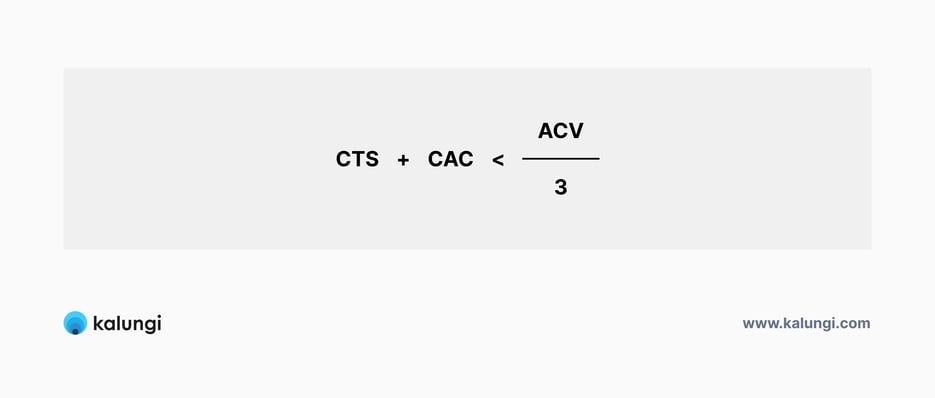
While CTS is understandably high in the earlier days of your growth, here is a formula that’ll help you stay on a sustainable path:
Here are some additional tips for reducing CTS:
Automate as much as possible: Automation can help reduce the cost of customer support and other services.
Outsource non-core functions: Outsourcing non-core functions can help to reduce the cost of providing products and services.
Use cloud-based solutions: Cloud-based solutions can help to reduce the cost of infrastructure and other costs.
Focus on high-value customers: Businesses should focus their resources on high-value customers who are most likely to generate revenue.
Improve customer satisfaction: By improving customer satisfaction, businesses can reduce the cost of churn and increase the lifetime value of customers.
Customer acquisition cost (CAC) is the total costs of acquiring new customers. It includes all marketing costs, sales enablement, tech stack, and people. lifetime value (LTV) is the total revenue a customer is expected to generate throughout their relationship with a business.
%20to%20lifetime%20value%20(LTV)%20ratio.webp?width=935&height=398&name=Customer%20acquisition%20cost%20(CAC)%20to%20lifetime%20value%20(LTV)%20ratio.webp)
The CAC to LTV ratio will tell you how sustainable your business model is and give you a baseline for growth opportunities.
A ratio below 3:1 will lead to slow growth. It means there isn’t enough margin from your average revenue and CAC. A ratio above 5:1 is a clue to potential growth opportunities—you can increase your marketing budget and acquire more customers.
Sustainable B2B SaaS ventures want to stay around a CAC:LTV of 3:1 to 5:1.
The 2023 edition of the famous technology landscape report of Scott Brinker showcased a whooping 11,038 solutions searchable on martechmap.com. At Kalungi, we believe Less is More. For SaaS venture booking $25-30M in ARR, we recommend reducing the total tool usage to less than five solutions. In fact, most B2B SaaS companies do not need more than a few solutions to support marketing, sales, and customer service.
Find the tech stack that allows you to:
Identify the metrics that are important to you for marketing, sales, and support.
You need to collect the data. This can be done manually or through a tool.
Once you have collected the data, you must analyze it to identify trends and patterns. This will help you to understand how your business is performing and identify areas where you can improve.
Once you have analyzed the data, you must automate as many actions as possible to improve your business.
Once you find the tools to collect, monitor and analyze the seven KPIs we discussed, you must keep up with your industry trends and ever-changing competitive landscape. The only way to do so is by benchmarking your performance against key players in your industry.
Our 2023 B2B SaaS Benchmarking Report provides a comprehensive look at industry standards, making it easier for you to see how your company measures up. Download it for free below and take the first step toward optimizing your strategy.
Looking for expert guidance to take your SaaS growth to the next level? Kalungi is a full-service B2B SaaS marketing agency specializing in helping SaaS companies build scalable, data-driven marketing strategies. Contact us today and let’s build a growth engine for your business.

Get your B2B SaaS company in front of the right customers with multi-channel marketing. Drive growth and establish your brand as an industry leader.
Looking for the best B2B SaaS marketing agency? Learn what separates strong agencies from weak ones and how to find the right fit for your stage.

Wondering If your B2B SaaS Marketing function needs a Partnerships Strategy? Get a first look into Channel Marketing strategy and a free Go-to-market...