Strategy & Planning
Measuring the ROI of Your SaaS Marketing Agency
To measure your SaaS marketing agency's performance, it's important to calculate your return on investment.


Brian Graf
How do you project lead generation for your B2B SaaS Marketing team? If you’re a Marketing leader, you know that you need to continually plan future hires, initiatives, & campaigns to be successful.
You also understand that if you want to set your team up for success, you have to align Marketing’s goals with your company’s growth goals using a system like Objectives and Key Results.
But knowing what metrics to gauge your team’s success with can be challenging, and many Marketing leaders struggle when deciding how many leads to sign up for. A high projection can create unattainable goals for your team, setting them up for failure and leading your team to lose credibility.
A low estimate can make you fail to push your team to its full potential and hinder your company’s growth.
Finally, these projections become the basis for your team’s critical Marketing initiatives and heavily influence the goals you set going forward.
Below is a step-by-step guide of the information you need to collect and the methods you can take to project your funnel successfully.
With this information (and the free template provided), you can forecast your funnel based on real data, set ambitious yet achievable goals for you and your team, and align marketing directly with your company’s growth goals.
First, ensure that you're accurately measuring your Marketing and Sales funnels. This data is the foundation for your projections, and the more detailed and accurate it is, the better your forecasts will be. Gather the total objects in each stage of the Marketing and Sales funnels monthly for the previous year.
There are two basic ways to do this, depending on the size of your company and how established your Marketing and Sales departments are:
Once set up, this system will automatically track your funnel and lead sources, website traffic, and just about every other important Marketing metric. It will also track contacts, companies, and deals as they enter the funnel and move from Marketing to Sales to closed-won.
This system is imperative to a high-performing Marketing department and is a must for every Marketing leader. But don’t just get a CRM just to get one. It’s essential that you know (and can accurately measure) your data before establishing fancy analytics tools. Without this knowledge, you will be measuring and making critical decisions based on flawed information, which could significantly impact your Marketing department’s performance.
At the same time every week (we do Monday mornings), write down how many new entries you received into each of your lifecycle and deal stages. We typically use this process for companies that don’t have an established Marketing discipline, as it is a quick and easy way to gain visibility into your funnel.
Although this is a manual process that takes time and discipline to complete, it forces you and your team to have intimate knowledge of your funnel and what contributes to it, ensuring that you start with a base of accurate data whenever you decide to automate things with a CRM.

There are a handful of critical metrics that heavily influence your Marketing projections. Ask salespeople, your CEO, or other executives to get your company’s historical averages for these.
The more data, the better. If you can collect these funnel KPIs, you’ll have a fantastic base to project your funnel and set accurate goals for your Marketing team going forward.
If you can’t find them for whatever reason, you can do two things to get yourself going:
1) Use industry standards to give yourself an educated guess.
2) Start measuring your funnel! The sooner you can have real numbers behind these metrics, the better you’ll be able to predict your funnel and have a baseline for the effectiveness of current and future marketing initiatives.
With company revenue targets, you’ll have a north star to work up to with your projections, making sure Marketing aligns with the rest of the company and generating the necessary demand to make both of you successful. Your company’s revenue targets will be a building block for your projections, allowing you to see what is expected of Marketing throughout the coming year.
They will also let you sanity-check your proposed priorities and help decide if your initiatives will be enough to hit the company’s goals. Company revenue targets also ensure that you and your team don’t get distracted from accomplishing your Marketing priorities by requests from other departments or the random projects that inevitably pop up throughout the year.
Talk to your CEO to understand what your company’s growth goals are. Are they based on Revenue? Logo increases? New markets entered? Market share gained? Figure out the area your CEO cares about and figure out what the metric is the company needs to hit. Then establish how large Marketing’s portion of that metric is.
This percentage will vary from company to company, as businesses that pursue different clients allocate revenue differently. (To learn more, take a look at this article on what marketing should contribute to the funnel).
You should be able to gather this information from either the CEO or the head of the Sales department. As growth is the primary focus of most companies, executives are usually required by their boards to have these goals on an annual or quarterly basis.
However, if, for whatever reason, you aren’t able to get the revenue or growth targets at the company level, you’ll have to make your own at the Marketing level. Based on your historical performance, how much can you grow this year?
Funnel conversion rates are the backbone of your Marketing projections. These numbers determine how many Leads are needed to make an MQL, how many MQLs are required to make an Opportunity, etc.
Small changes in these conversion rates can drastically change your Marketing outlook and plans to grow your company.
With the historical funnel data you collected earlier in the blog, calculate the average conversion rates for each stage in your Marketing and Sales funnel. Divide the lower stage by the upper stage to get this number (e.g., to get the conversion rate from leads to MQLs, divide the number of MQLs by the number of Leads).
These calculations will give you an accurate view of your historical funnel efficiency, where you are successful, and where you need to improve. Then do the same thing for the total conversion rates for the Sales and Marketing funnels separately and together.
You can accomplish this by dividing the bottom-funnel stage by the top funnel stage (e.g., to measure the entire funnel conversion rate, divide your number of customers by your number of contacts).
This will give you a full picture of each org’s effectiveness, as well as the company’s business development success, as a whole.
Note: Make sure that you measure your leads by when they were created, not when they moved stages. Measuring leads by when they were created gives you an accurate picture of your funnel’s efficiency because you are answering the question: of the Contacts that came in during November, how many converted to each stage in the funnel?
On the other hand, if you measure your funnel based on when leads came into each funnel stage, a lead contact made in November could turn into an opportunity in December, limiting your ability to see your funnel efficiency accurately.
Also, ensure that you have established a clear set of criteria for each funnel stage. This way, Sales, Marketing, and executives agree about what each of the numbers in the funnel means. For more information on establishing funnel stage definitions, read this blog.
Suppose you can’t measure your historical funnel data. In that case, your funnel projections will be much less accurate because you will be projecting your Marketing success based on guesses instead of real data.
But! Before you lose hope and give up on this exercise, it doesn’t mean that you shouldn’t forecast your Marketing funnel.
You can use industry conversion benchmarks to give an estimation of how your funnel will probably behave and forecast your numbers that way. Just go into this exercise knowing that these numbers are only estimations and that your actual success could vary from what your table shows.
The Average Contract Value is the average recurring revenue collected per contract in one year. Note that because this only looks at recurring revenue, the ACV does not include one-time fees such as consulting or onboarding services.
This metric is a good proxy for your company’s average deal size, and as a result, it is critical for figuring out how many deals you’ll need to close to hit a revenue goal.
Bonus: You can also use the average deal size along with the funnel conversion rates (above) to assign dollar values to MQLs by mapping the MQLs’ propensity to close (total conversion rate) to the ACV. This revenue attribution can be a great way to showcase Marketing’s ROI or even the ROI of specific marketing channels.
Measure the first-year revenue from all current (and previous) clients. Then subtract all one-time fees that you collected from those customers. Finally, take an average of this number for all the clients you collected data for.
Talk to Sales or executives if the data isn’t available. They can often give you a guesstimate, based on their previous experience with clients and business development.
If that doesn’t work, though, you can create an estimation based on your current pricing. How much first-year recurring revenue would a contract bring in? If you have more than one pricing tier, what percentage of deals are you expecting to close in each tier?
To accurately project your funnel, you’ll need to know how long it takes a deal to go through your sales funnel. That’s where the Sales Cycle comes in handy. Your Sales Cycle measures the average time it takes a prospect to go from entering the funnel to becoming closed-won.
This metric changes how long it takes for your leads to convert to closed-won and ultimately affects how many leads you need to generate in a given year. For instance, if you need to generate 100 leads worth of customers this year, and your Sales Cycle is three months, you’ll really have to generate 100 leads by the end of September.
Look at your list of customers and calculate the average lifespan of those customers before they became closed-won. Most CRMs should allow you to do this pretty quickly.
Talk to Sales to get their best guess. Most salespeople should have a handle on this, as it affects their projections as well. One thing to note, though, is that Sales’ estimations of Sales Cycle may be artificially short, as they usually only consider the Sales funnel when making this calculation.
You’ll want to consider both Sales and Marketing funnels when making this calculation to get the real-time it takes to convert a contact to a customer.
Now that you’ve collected all of your critical forecasting metrics, it’s time to project your funnel. In my experience with clients, I’ve found that there is no silver bullet for this, but there are two methods that I have used with clients in the past that will give you a great base to start with.
I’ve attached a free version of both at the beginning and end of this blog, so feel free to download them and build a funnel projection for your company.
But how do you know which version to use? That depends on how established your company is, and more importantly, how established your funnel attribution is.
The first option is the ideal method, as it uses your company’s historical Sales and Marketing data. It also projects your data forward, based on the assumed growth rates from new Marketing initiatives, expanding Marketing bandwidth, new market entrances, optimizations of current campaigns, etc.
For this model to be successful, though, you need to have accurate historical funnel data. Without that, the model will probably do more harm than good. If you already have your historical funnel data, you’re in the right place! Keep reading to learn how to fill out the model. If you don’t have historical data, skip ahead to the next section.
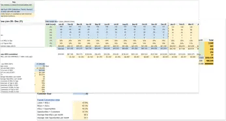
To set this model up, go to the “[Template] 2020/21 Funnel (Growth Projections)” tab in the funnel projection template. From here, all you need to do is fill out the cells in blue and green.
Once you’ve filled this information in, your model should be up and running. It will give you a reasonable estimation of what you can expect if your assumptions hold throughout the year.
If you don’t have historical funnel data, don’t panic. I work with plenty of B2B SaaS startups that haven’t been able to establish proper attribution systems. As long as you start measuring your funnel now, you’ll be just fine.
Here’s a funnel projection method you can use that doesn’t need historical data and can give you a benchmark to measure against as you get your new attribution system, new Marketing channel, or new company off the ground.
To set this model up, go to the “[Template] 2020/21 MQL Projections (Revenue goals)” tab in the funnel projection template. From here, all you need to do is fill out the cells in blue.
With all of the above information in, your model should be good to go! Make some changes to your assumptions and see how they affect your projections.
Note: Keep in mind that because this model isn’t based on historical data, it is just an educated guess and is likely to change quite a bit in practice. You should only use it as a starting point and begin adjusting your assumptions once you have a few months of data.
It’s essential that you don’t place too much reliance on these models. They should be used as goal-setting tools but shouldn’t be treated as gospel. No data attribution system is perfect, and many are flawed, which can significantly influence these models to make inaccurate projections.
Use these tools to start meaningful conversations with your Sales and executive teams and establish a benchmark that you can compare your actual data with as you go forward.
With that in mind, I hope you enjoy our tools and that they can help you align your Marketing org behind your company’s growth goals and allow you to help your company reach its full potential.
See below for an Excel document that has free templates for you to use with each projection version and sheets with example data, so you can see how the models work.
Enjoy!


To measure your SaaS marketing agency's performance, it's important to calculate your return on investment.
Struggling to align your B2B SaaS sales and marketing funnel? Learn how to structure each funnel stage to drive predictable revenue growth.

Learn to calculate and use the LTV to CAC ratio for SaaS. Make data-driven decisions and ensure sustainable growth for your business."