Increased accountability over time
For clients that commit to long-termWe classify long-term engagements as those that span 3 or more months engagements we feel comfortable enabling pay-for-performance (PFP). When PFP is enabled, we split your total contract value into two separate components: fixed and variable.
As Kalungi builds your marketing function over time, your fixed contribution shrinks while your variable contribution grows. The reasoning here is simple: as foundations are built and momentum is stacked, we feel more equipped to take accountability for downstream results.
This table illustrates how fixed and variable components change over the course of a year-long full-serviceFull-service engagements are those that include both Marketing Leadership and agency services together. engagement.

How we measure variable performance
Kalungi uses quarterly Objectives and Key Results (OKRs) to measure performance. The better our team performs against the OKRs, the more of the variable portion of the contract we retain. This can be as low as 0% and as high as 125%.
This table shows how OKR performance impacts the variable portion of your contract.

Why 71–80% completion = 100% payout
OKRs are stretch goals. Our team designs each individual Key Result to reflect performance between 81–100% as excellent, 71–80% as very good, 51–70% as good, and 0–50% as poor.
Building OKRs this way (where 71–80% equals 100% payout) pushes our teams to consider what excellent performance (81–100%) looks like and also ensures each key result is achievable and grounded in reality (71–80%).
We also believe rapid growth for your company isn't achieved by making safe bets.
The 71–80% band helps us determine what "on-track" looks like, then provides upward mobility to give Kalungi credit for overperformance and downward mobility to reduce your risk if Kalungi underperforms.
Over and underperformance
At this point, you might ask yourself: "If Kalungi overperforms on its OKRs, does that mean I will pay more than the original contract amount?"
Yes. If our team completes OKRs in the 81–100% range, we'll ask for 125% of the variable component of your contract.
However, this mechanic is designed to be mutually beneficial. While you may pay more for a high-performance quarter, you'll also pay less if we underperform. The majority of this risk is placed on Kalungi's shoulders.
If Kalungi performs excellently in a quarter, the maximum overage you'd pay for that overperformance is +25% of your variable contract.
If Kalungi underperforms in a quarter, you could pay as little as 0% of the variable component of your contract.
Use the OKR scenario planner for a clearer picture of how Kalungi's OKR performance impacts contract payouts.
Typical OKR examples
Each quarter, your Associate CMO will propose a new set of OKRs based on their assessment of your company's needs along with your agreed-upon growth priorities.
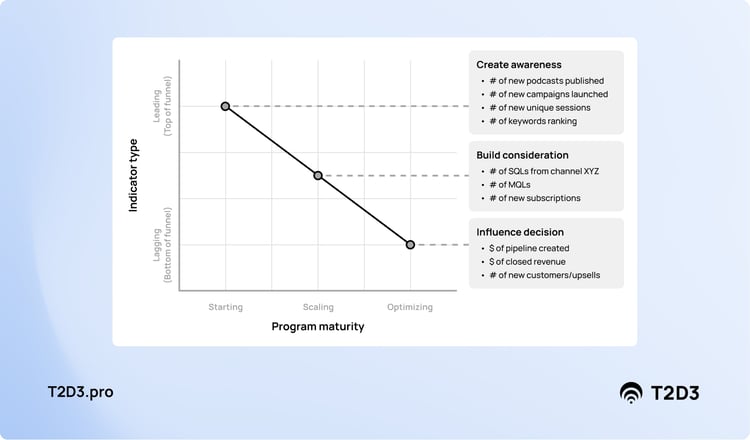
Beginning: In the early stages of an engagement, OKRs often prioritize regular shipment of work and foundation building. When you’re creating a marketing function from scratch, producing sustainable momentum is crucial. This usually means most OKRs will be activity-based and centered around the top-of-the-funnel.
Middle: Once the foundation is built, more middle-of-the-funnel (MOFU) metrics are introduced to measure success. This helps the team stay focused on snowballing their momentum without accidentally incentivizing them to cut corners with bottom-of-the-funnel metrics too soon.
End: Once you've created a channel or two that reliably produces both TOFU and MOFU results, OKRs will be introduced that help your team focus on converting those results to qualified opportunities, pipeline, and revenue.
The image below illustrates this idea visually.
Below is a generalized sample of four sets of OKRs to provide an idea of what these might look like in a typical engagement. Not every engagement is the same. These OKRs will be entirely dependent on your company's product, team, growth stage, growth priorities, category maturity, and the amount of foundation you've already built.